
How Does Air Pollution Affect Visibility? The Science of Haze, Light Scattering, and AQI
- APSEd

- Mar 23
- 4 min read
Why does smoggy air look brown or hazy? Learn how air pollutants reduce visibility through light scattering and absorption, how the Coefficient of Haze (COH) is measured, and how visibility feeds into the Air Pollution Index.
You've seen it on winter mornings in Delhi or during crop-burning season in Punjab — a thick, brownish-grey haze sitting over the city, reducing a skyline to a blur. But why exactly does polluted air look hazy? And how does visibility translate into an air quality number? Here's the science explained clearly.
What Is Visibility in Air Quality Terms?
Visibility is the maximum distance at which an object can be clearly seen and identified. It's not just about aesthetics — reduced visibility affects aviation safety, road transport, and is a direct indicator of particulate matter loading in the atmosphere.
In air quality science, visibility is one of six standard parameters used in calculating India's Air Pollution Index (API). As pollutant concentrations increase, visibility decreases — making it both a health-proxy and a practical metric. The complete list of parameters and how they are combined into a final AQI score is covered in our AQI calculation guide.

How Do Air Pollutants Reduce Visibility?
The mechanism is rooted in how light travels through the atmosphere.
Step 1: Particles Enter the Air
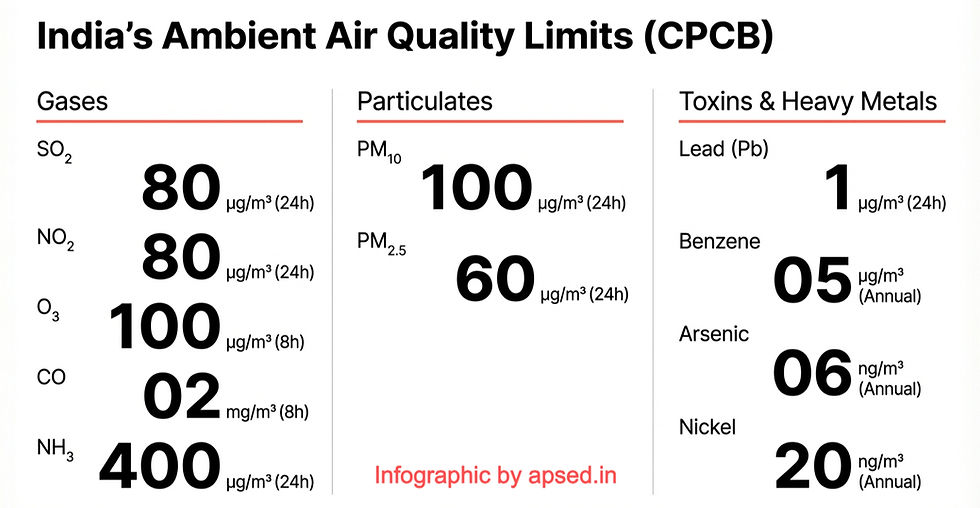
When combustion, construction, vehicles, or agricultural burning release matter into the air, tiny solid and liquid particles — particulate matter (PM) — become suspended in the atmosphere. These range from coarse dust (PM10) to ultrafine soot particles (PM2.5). India's NAAQS sets the legal concentration limits for both PM10 (100 µg/m³ over 24 hours) and PM2.5 (60 µg/m³ over 24 hours).
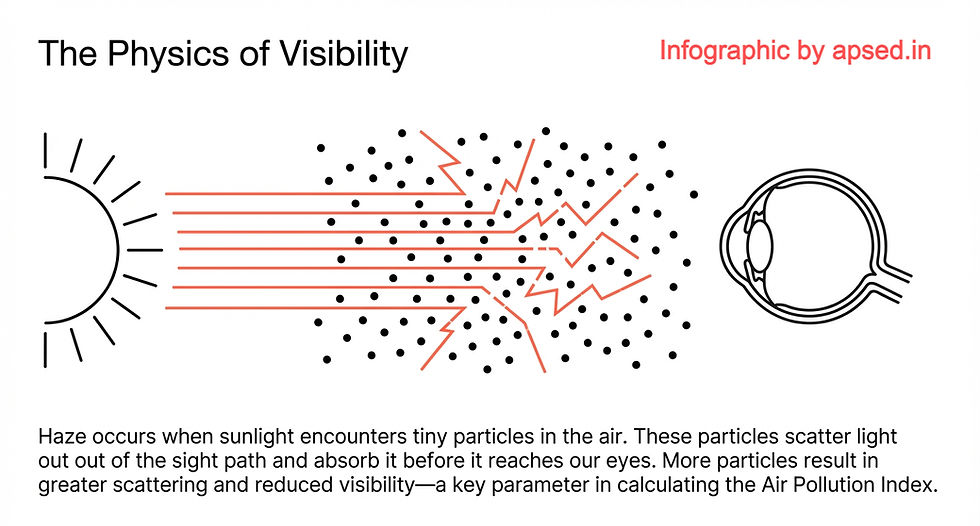
Step 2: Light Scattering
When sunlight travels through air carrying suspended particles, the particles scatter light in multiple directions — including away from the path it was travelling. This means less light reaches your eyes from the direction of the object you're looking at.
Step 3: Light Absorption
Some particles (especially black carbon/soot from diesel and biomass burning) don't just scatter light — they absorb it, converting light energy into heat. This contributes to the brownish or dark appearance of polluted air.
The Result
The combined effect of scattering and absorption:
Distant objects lose contrast and appear washed out
The sky takes on a white, grey, or brown tint depending on the composition of particles
Colour rendering deteriorates — objects appear less vivid, and distinguishing textures becomes difficult
The more particles in the air, the more scattering occurs, and the lower the visibility.
What Creates Brown Haze vs. White Haze?
Haze Colour | Dominant Particles | Typical Source |
Brown/Orange | Nitrogen dioxide (NO₂), nitrates, soot | Diesel vehicles, biomass burning |
White/Grey | Sulphates, ammonium nitrate, sea salt | Industrial emissions, high humidity |
Blue-Grey | Fine carbonaceous particles | Cooking fires, wildfires |
The iconic orange skies seen in wildfire-affected cities occur when wildfire smoke carries brown carbon and soot high into the atmosphere, filtering sunlight before it reaches the ground — the same phenomenon shown in the cover image of APSEd's Air Quality module.
Measuring Visibility Reduction: The Coefficient of Haze (COH)
In air quality monitoring, visibility reduction from particulate matter is quantified using the
Coefficient of Haze (COH) — a standard unit for the soiling index.
Soiling Index: A measure of the transmission of light through particulate matter collected on a filter paper over a prescribed period of time. The lower the light transmission, the higher the COH value, indicating dirtier air.
COH values — alongside visibility in km — feed directly into the Method 3 sub-index calculation for the Air Pollution Index. Notice the clear inverse relationship: as COH rises, visibility drops, and the sub-index worsens:
COH (units) | Visibility (km) | Sub-Index (Aᵢ) |
0 – 0.5 | 12 – 24 | 2 (best) |
0.5 – 1.0 | 8 – 12 | 4 |
1 – 2 | 6 – 8 | 8 |
2 – 3 | 4 – 6 | 12 |
3 – 4 | 2 – 4 | 16 |
4 – 5 | 0 – 2 | 20 (worst) |
This table is part of the broader Method 3 AQI calculation, where all five sub-indices are summed to get a final API score.
Visibility as One of Six AQI Parameters
India's Air Pollution Index (API) includes visibility as one of its standard calculation parameters, alongside SPM, SO₂, CO, NO₂, and photochemical oxidants. By including visibility, the index captures a real-world, observable effect of pollution — not just a laboratory measurement.
The pollutants that most directly degrade visibility — PM2.5, PM10, NO₂ — happen to be the ones with the strictest limits under India's NAAQS. When these breach their thresholds, both the AQI and your eyes tell the same story.
Why Visibility Matters Beyond AQI
Visibility is not merely a comfort issue:
Aviation: Airports require minimum visibility for safe landing and takeoff. Heavily polluted episodes have caused flight cancellations and delays across North Indian airports.
Road accidents: Reduced visibility in haze and smog directly increases collision risk on highways.
Ecological impacts: Reduced solar radiation in heavily polluted regions affects plant photosynthesis and agricultural yields.
Quick Summary
Air pollutants reduce visibility through light scattering and light absorption
More particles in air = more scattering = lower visibility
Visibility is measured as a sub-index in the API using the Coefficient of Haze (COH) and visibility range in km
Visibility is one of six standard parameters used to compute the API in India
Poor visibility is both a health signal and a direct impact of air pollution on daily life
Further Reading
On this blog:
External resources:


Comments