
National Ambient Air Quality Standards (NAAQS) India: CPCB Limits for All 12 Pollutants
- APSEd

- Mar 23
- 4 min read
Complete guide to India's National Ambient Air Quality Standards (NAAQS) notified by CPCB. Get the legal limits for all 12 pollutants — SO₂, NO₂, PM2.5, PM10, O₃, Pb, CO, benzene, and more — with measurement methods.
India's National Ambient Air Quality Standards (NAAQS) are the legal backbone of air quality regulation in the country. If you're preparing for GATE ES, UPSC, or working in environmental compliance, you need to know these numbers — not just that they exist.
This article gives you the complete NAAQS table for all 12 pollutants, explains what "ambient air quality" means, and clarifies the difference between industrial/residential areas and ecologically sensitive zones.
What Are Ambient Air Quality Standards?
Air quality standards are the legal limits on the concentration of pollutants in ambient (outdoor) air during a specified time period. They represent the maximum allowable level of a pollutant to protect public health, ecosystems, and property.
In India, these standards are set by the Central Pollution Control Board (CPCB) under the Ministry of Environment, Forest and Climate Change, exercising powers under the Air (Prevention and Control of Pollution) Act, 1981. The current standards were notified in 2009 and cover 12 pollutants.
These NAAQS limits are also the denominator in every AQI sub-index calculation — so understanding NAAQS is the foundation for understanding how India's AQI works.
Key factors that influence how standards are set:
Economic feasibility
Social context
Available measurement technology
Political considerations
Health and ecological data
NAAQS India: Complete Table (All 12 Pollutants)
Concentrations are given for two area types:
Industrial, rural, residential, and other areas
Ecologically sensitive areas (national parks, wildlife sanctuaries, hill stations)
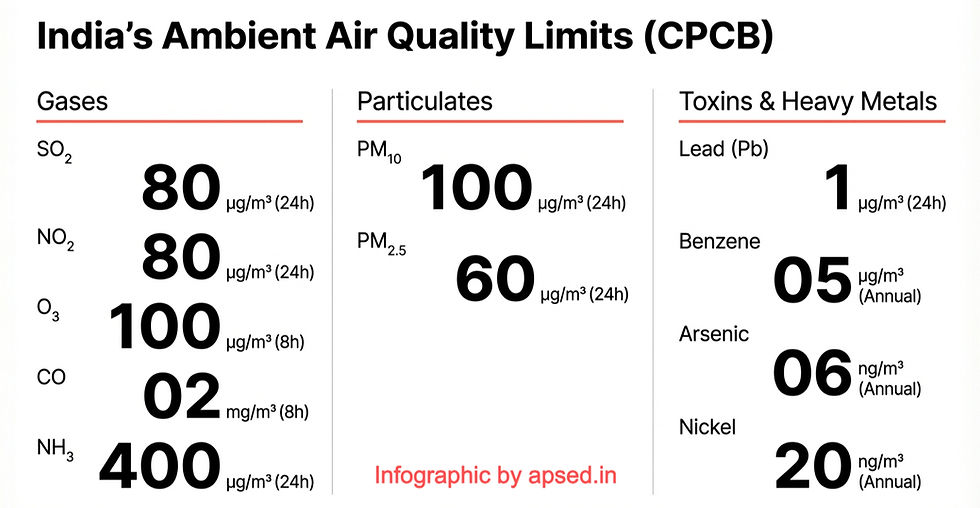
Group 1: Gaseous Pollutants
Pollutant | Averaging Period | Industrial/Residential | Ecologically Sensitive | Measurement Method |
SO₂ (µg/m³) | Annual | 50 | 20 | UV Fluorescence / Improved West & Gaeke |
24-hour | 80 | 80 | ||
NO₂ (µg/m³) | Annual | 40 | 30 | Modified Jacob & Hochheiser |
24-hour | 80 | 80 | ||
O₃ (µg/m³) | 8-hour | 100 | 100 | UV Photometric / Chemical method |
1-hour | 180 | 180 | ||
CO (mg/m³) | 8-hour | 2 | 2 | NDIR method |
1-hour | 4 | 4 | ||
NH₃ (µg/m³) | Annual | 100 | 100 | Indophenol blue method |
24-hour | 400 | 400 |
Group 2: Particulate Matter
Pollutant | Averaging Period | Industrial/Residential | Ecologically Sensitive | Measurement Method |
PM10 (µg/m³) | Annual | 60 | 60 | Gravimetric / TOEM |
24-hour | 100 | 100 | ||
PM2.5 (µg/m³) | Annual | 40 | 40 | Gravimetric / TOEM |
24-hour | 60 | 60 |
Group 3: Heavy Metals and Toxic Organics
Pollutant | Averaging Period | Industrial/Residential | Ecologically Sensitive | Measurement Method |
Pb (µg/m³) | Annual | 0.5 | 0.5 | Teflon filter method |
24-hour | 1 | 1 | ||
Benzene (µg/m³) | Annual | 5 | 5 | Gas chromatography-based continuous analyser |
Benzo[a]pyrene (ng/m³) | Annual | 1 | 1 | Solvent extraction followed by HPLC |
Arsenic (ng/m³) | Annual | 6 | 6 | AAS/ICP method (EPM 2000 filter) |
Nickel (ng/m³) | Annual | 20 | 20 | AAS/ICP method (EPM 2000 filter) |
Key Observations From the NAAQS Table
1. Ecologically sensitive areas get stricter limits — but only for some pollutants. SO₂ annual limit drops from 50 to 20 µg/m³ for sensitive areas, and NO₂ annual limit drops from 40 to 30 µg/m³. However, for PM10, PM2.5, and most others, the limits are the same across all area types.
2. Short-term (24-hour) limits are higher than annual limits. For SO₂, the annual limit is 50 µg/m³ but the 24-hour limit is 80 µg/m³. This makes scientific sense: the body can tolerate a short-term spike that it cannot sustain year-round.
3. Units vary by pollutant type:
µg/m³ for most pollutants
mg/m³ for CO (heavier gas, measured in higher concentrations — a common exam trap)
ng/m³ for trace toxic compounds like benzo[a]pyrene, arsenic, and nickel
4. Benzene, benzo[a]pyrene, arsenic, and nickel are NOT included in India's AQI calculation — though they are part of NAAQS. India's AQI covers 8 of the 12 NAAQS pollutants.
Other Types of Air Quality Standards
Beyond NAAQS, two other standard types are worth knowing:
Point of Impingement Standards
Also called quasi-emission standards, these set limits on specific pollutants in ambient air at ground level at the boundary of an emission source. They are used in dispersion modelling to determine how much a specific source (factory, plant) can emit.
Soiling Index
This measures the transmission of light through particulate matter collected on a filter paper over a fixed time period. It quantifies the "dirtying" effect of air pollution — and is also the basis for the Coefficient of Haze (COH) parameter used in AQI Method 3. Read more about how particulate matter reduces visibility and how COH is measured.

NAAQS vs. AQI — What's the Difference?
Feature | NAAQS | AQI |
Purpose | Legal standard for regulatory compliance | Public communication tool |
Coverage | 12 pollutants | 8 pollutants |
Output | Specific concentration limits | Single number (0–500) with colour |
Audience | Regulators, industries, scientists | General public |
Launched | 1982 (revised 2009) | 2014 |
Think of NAAQS as the rulebook and the AQI as the scoreboard that translates those rules into something everyone can understand at a glance.
Summary
From the NAAQS table, focus on:
Annual limits for SO₂, NO₂, PM10, PM2.5 in both area types
CO is reported in mg/m³ (not µg/m³) — a common trap
Pb annual standard = 0.5 µg/m³ (same for both zones)
Measurement methods: TOEM for PM, NDIR for CO, UV Fluorescence for SO₂
The distinction between 24-hour and annual averaging periods
Further Reading
On this blog:
External resources:


Comments